Roll rate, cure rate, PTP kept: the collections KPIs that show where credit cost is heading
Collections KPIs to track by bucket: roll rate, cure rate, flow to NPA, promise-to-pay kept and right-party contact, with formulas and a worked NBFC example.
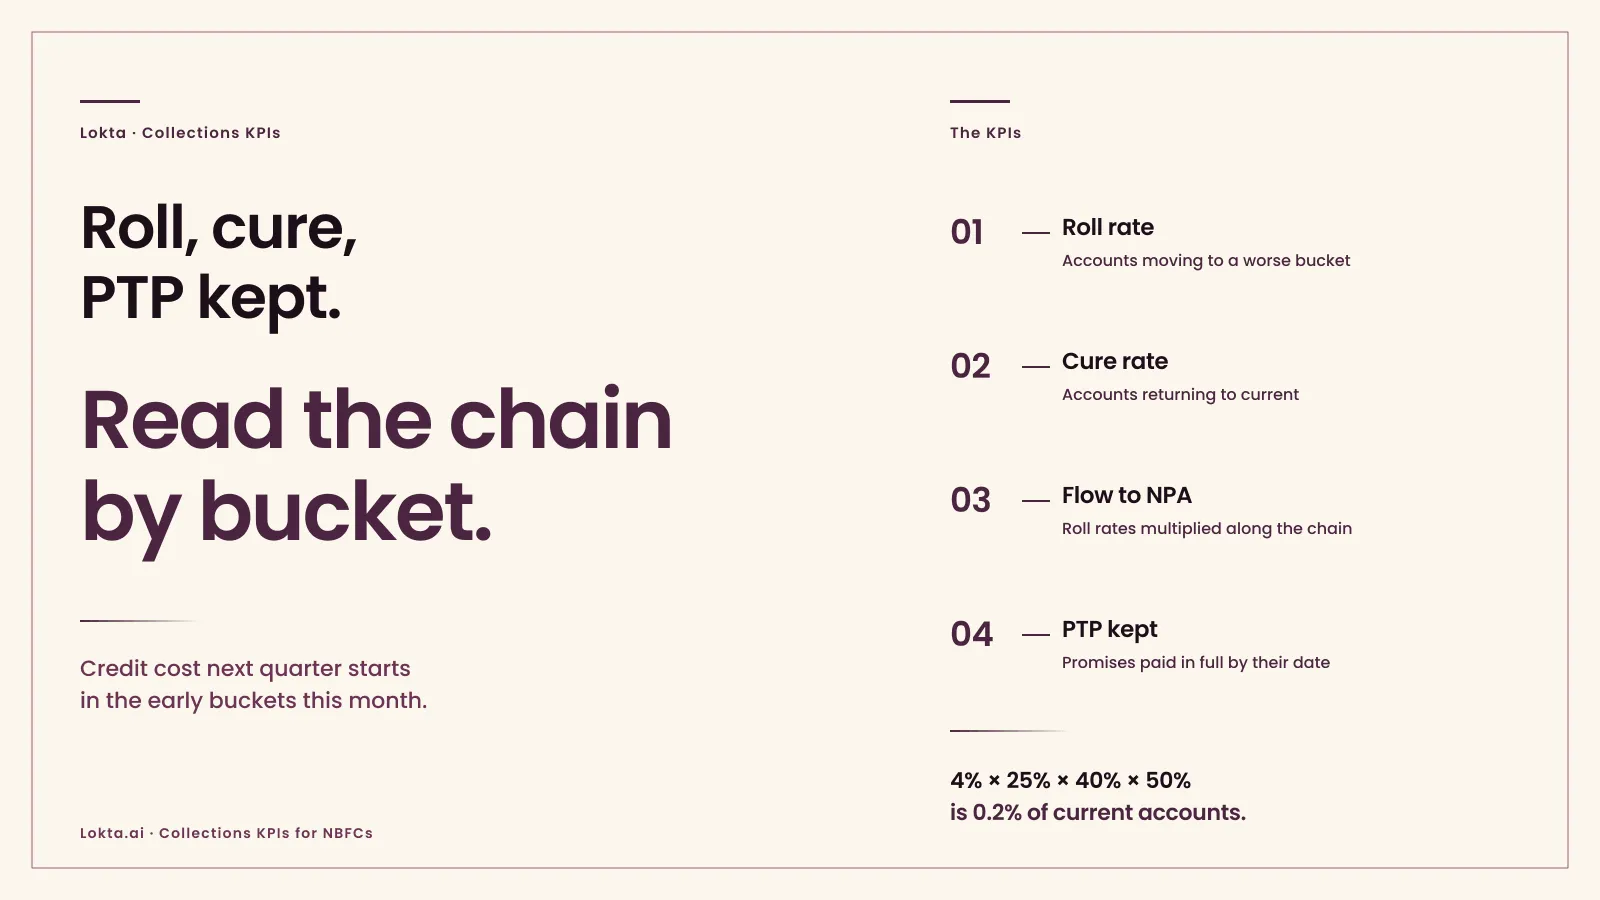
Track five collections KPIs by delinquency bucket: roll rate (accounts moving to a worse bucket), cure rate (accounts returning to current), flow rate to NPA (roll rates multiplied along the chain), promise-to-pay kept rate, and right-party contact rate. Roll and cure rates show where credit cost is heading. PTP kept and contact rates show whether today’s collections work is causing the change.
If you run collections at an NBFC, your credit cost next quarter is being decided in the early buckets this month. The KPIs that show it are the ones that follow accounts from one month to the next.
A single collection efficiency figure cannot do that. It reports what came in against what was billed, and it says nothing about which accounts are sliding toward 90 days or which treatment is pulling them back. Roll rates, cure rates and a few measures of the collections work itself do, provided they are read bucket by bucket from a history the loan system keeps.
- Read the shares together. In 1-30, every account rolls forward, cures or stays. From 31-60 a fourth share appears: rollbacks to a better bucket.
- Multiply the rolls to see NPA coming. The product of roll rates from current to 90 days is the share of today’s current accounts on course to become NPA.
- An early change carries to the end. In the example below, five points off the 1-30 roll rate take a fifth off the flow to NPA.
- PTP kept tests the contact. A promise needs an amount and a date, or it cannot be counted.
- Keep the history. The loan system has to keep each account’s bucket at every month end, not only today’s.
Which collections KPIs matter most?
Five, each read by bucket.
| KPI | Formula | What it tells you |
|---|---|---|
| Roll rate | Accounts in bucket B last month that are in the next bucket this month ÷ accounts in bucket B last month | How fast accounts are slipping |
| Cure rate | Accounts in bucket B last month that are current this month ÷ accounts in bucket B last month | How many come back to current, through collections work or on their own |
| Flow rate to NPA | Roll rates from current to 90+ days multiplied together | The share of current accounts on course for NPA |
| PTP kept rate | Promises paid in full by their date ÷ promises falling due in the period | Whether the conversations produce payments |
| Right-party contact rate | Contacts with the borrower ÷ connected calls | Whether the team can reach the people it needs to |
Each rate can be counted by accounts or by balance. Count by accounts to judge the collections work, and by balance to judge the money at risk. Say which one a report uses.
What is roll rate in collections?
The share of accounts in one bucket that are in the next, worse bucket a month later. If 2,000 accounts were 1-30 days past due at the end of September and 500 of them are 31-60 at the end of October, the 1-30 to 31-60 roll rate is 25%.
A roll rate needs the same accounts at two dates. A report that only shows how many accounts sit in each bucket today cannot produce it.
What is cure rate in collections?
The share of accounts in a delinquent bucket that are current a month later, with nothing overdue. In the same example, if 1,100 of the 2,000 accounts in 1-30 at the end of September are current at the end of October, the cure rate is 55%. The other 400 stayed in 1-30.
In 1-30, roll, cure and stay add up to the whole bucket: 25% plus 55% plus 20% is 100%. From 31-60 onward some accounts roll back to a better bucket without curing, a fourth share to track. A roll rate that falls because more accounts stayed put is a different result from one that falls because more accounts cured, and only the three together show which happened.
How do roll rates become a credit cost forecast?
By multiplying along the chain. Take an illustrative book. The numbers are round ones chosen for the arithmetic, not any lender’s results.
4% roll from current into 1-30 (the X bucket: current when the month began, unpaid at its end), 25% from 1-30 to 31-60, 40% from 31-60 to 61-90, and 50% from 61-90 past 90 days.
4% × 25% × 40% × 50% is 0.2%. If the rates hold, 200 of today’s current accounts are past 90 days four month-ends from now, and accounts that stall for a month add to that later.
Cut the 1-30 roll rate from 25% to 20% and the flow falls to 0.16%, or 160 accounts. One early bucket moved the end of the chain by a fifth.
Each account that crosses 90 days turns into a cost. RBI’s NBFC directions on income recognition and provisioning recognise income on an NPA only when it is realised, reverse income booked before it turned NPA and still unpaid, and set a provision of 10% of total outstanding on a sub-standard asset (for Ind AS lenders, the prudential floor beside expected credit loss). A flow rate turns those rules into a number the finance team can plan for months ahead.
What do PTP kept and right-party contact tell you?
Whether the collections work is the reason roll and cure rates move.
A promise to pay counts only with an amount and a date. The PTP kept rate is the share of promises falling due in the period that were paid in full by their date. Part-payments are worth tracking separately. A falling kept rate in the 1-30 bucket can show up in its roll rate a month later.
Right-party contact rate is the share of connected calls that reached the borrower rather than a wrong number or a relative. Track unanswered attempts separately as the connect rate. If it drops, the team is spending effort it cannot convert, and the cause may be contact data rather than the script. A falling contact rate is never a reason to widen the calling hours: RBI’s conduct directions for NBFCs bar recovery calls before 8 a.m. and after 7 p.m. (before 9 a.m. and after 6 p.m. on microfinance loans).
How should the KPIs be cut?
By bucket first, then by the dimensions that explain a change:
- vintage, the month the loan was disbursed, to separate a weaker cohort from weaker collections
- product and channel, because a small-ticket digital loan and a secured loan do not roll the same way
- geography and field team, to find where the work is and is not landing
- treatment, to compare a new strategy with the current one, as the bucket-by-bucket collection strategy sets out
Portfolio reporting for the CRO and the board, and why it so often ends up rebuilt in Excel, is covered in loan portfolio analysis.
What does the loan system need to keep?
The account’s bucket at every measurement date, kept as history rather than overwritten, and the collections events linked to the account:
- days past due and bucket for every account at every month end, and ideally every day
- each promise to pay with its amount, date and outcome
- each contact attempt with its channel, time and result
- the treatment each account was under at each date
With that history, every rate in this post is a query. Without it, last month’s buckets have to be rebuilt from a backup or an old report, and two people rebuilding them can get different roll rates.
Where do agents fit in collections reporting?
In computing, watching and proposing. An agent can recompute roll, cure and kept rates every day for every cut, flag the bucket where a rate has moved beyond its usual range, and propose a treatment change to test against the current one. The lender’s people decide whether the change goes live, and the record keeps who approved it.
Which measures should your collections team run on?
If you want to be the head of collections who answers the credit committee on which bucket is driving next quarter’s credit cost, and why, the choice is which measures you run on.
- Track collection efficiency and bucket counts on a monthly dashboard. It is quick to set up. It shows the result after it has happened and cannot say which accounts moved or why.
- Track roll, cure, PTP kept and contact rates by bucket and vintage from account-level history in the loan system. It takes a history the system must keep and definitions the team must agree once. After that the rates explain each other and point to the bucket to work on.
- Rely on the pool performance reports that funders and rating agencies ask for. They are built for funders and raters. They arrive monthly, cover pools rather than your whole book, and leave the collections team without its own measures.
The second path costs effort before it pays. Month-end bucket history has to be kept from the start, and promises and contact outcomes have to be recorded with amounts, dates and codes the team uses the same way.
Lokta’s loan management system is a double-entry, event-sourced ledger, so each account’s history is kept rather than overwritten. Lokta’s AI Loan Servicing tracks promises to pay and borrower contact on the account, and carries each outcome back to the live loan. Both come from the team that built Apache Fineract.
Frequently asked questions
What is roll rate in collections?
Roll rate is the share of accounts, or of balance, in one delinquency bucket this month that moves into the next, worse bucket by the next month. A 1-30 DPD to 31-60 DPD roll rate of 25% means a quarter of last month's 1-30 accounts are now 31-60. Tracked bucket by bucket, roll rates show where accounts are slipping before they reach NPA.
What is the difference between roll rate and cure rate?
Roll rate measures accounts moving to a worse bucket. Cure rate measures accounts in a delinquent bucket that return to current, with nothing overdue, by the next measurement date. Some accounts do neither and stay in the same bucket, and from 31-60 onward some roll back to a better bucket without curing. The shares together add up to the whole bucket, so reading one without the others can mislead.
What does PTP mean in collections?
PTP stands for promise to pay: the borrower names an amount and the day it will arrive. The PTP kept rate is the share of promises falling due in a period that were paid in full by the promised date. A promise without an amount and a date cannot be measured, so the collections record should hold both.
Which collections KPIs predict credit cost?
Roll rates from each bucket to the next, multiplied along the chain to 90 days past due, give the share of today's current accounts likely to become NPA if the rates hold. Each of those accounts then carries a provision and has its income recognised only when realised. Cure rates and PTP kept rates in the early buckets are the leading signs that the chain is changing.
Sources:
- Reserve Bank of India (Non-Banking Financial Companies - Income Recognition, Asset Classification and Provisioning) Directions, 2025: paragraph 38 (income on NPAs recognised only when realised, and reversal of unrealised income) paragraph 32(1) (provision of 10% of total outstanding on sub-standard assets) and paragraph 34 (the prudential floor for Ind AS lenders).
- Reserve Bank of India (Non-Banking Financial Companies - Responsible Business Conduct) Directions, 2025: paragraphs 91(2) and 100 (recovery contact hours and conduct, for microfinance and other loans).