What it costs to service a loan: a cost-per-loan model for an NBFC book
How to work out what it costs an NBFC to service a loan: what RBI's ratios show, why delinquent loans cost more, and a cost-per-loan model from your books.
No published figure gives the cost of servicing a loan at an Indian NBFC. RBI publishes ratios: operating expenditure was 2.6% of total assets at Upper Layer NBFCs and 1.6% at Middle Layer NBFCs in 2024-25. A lender builds its own cost per loan by allocating servicing, collections, compliance and technology cost to active loans, then splitting performing from delinquent. Delinquent loans draw far more work, and that split shows where servicing cost eats into profit per loan disbursed.
If you run finance or operations at an NBFC, your cost-to-income ratio sits in the annual accounts to one decimal place. Your cost per loan does not, and it is the figure that decides whether a product, a channel or a collections strategy earns its keep.
The gap matters because servicing cost does not spread evenly across the book. A loan that pays on time needs a receipt and a bureau record each month, and a statement when the rules call for one. A loan in 31-60 days past due needs calls, visits, notices and sometimes an agency. Averaging the two hides which of your loans are paying for the others.
- No Indian per-loan benchmark exists. RBI publishes ratios to income and assets, not a cost per loan.
- Cost-to-income is the wrong tool. RBI’s version includes provisions and write-offs, so it mixes credit cost with operating cost.
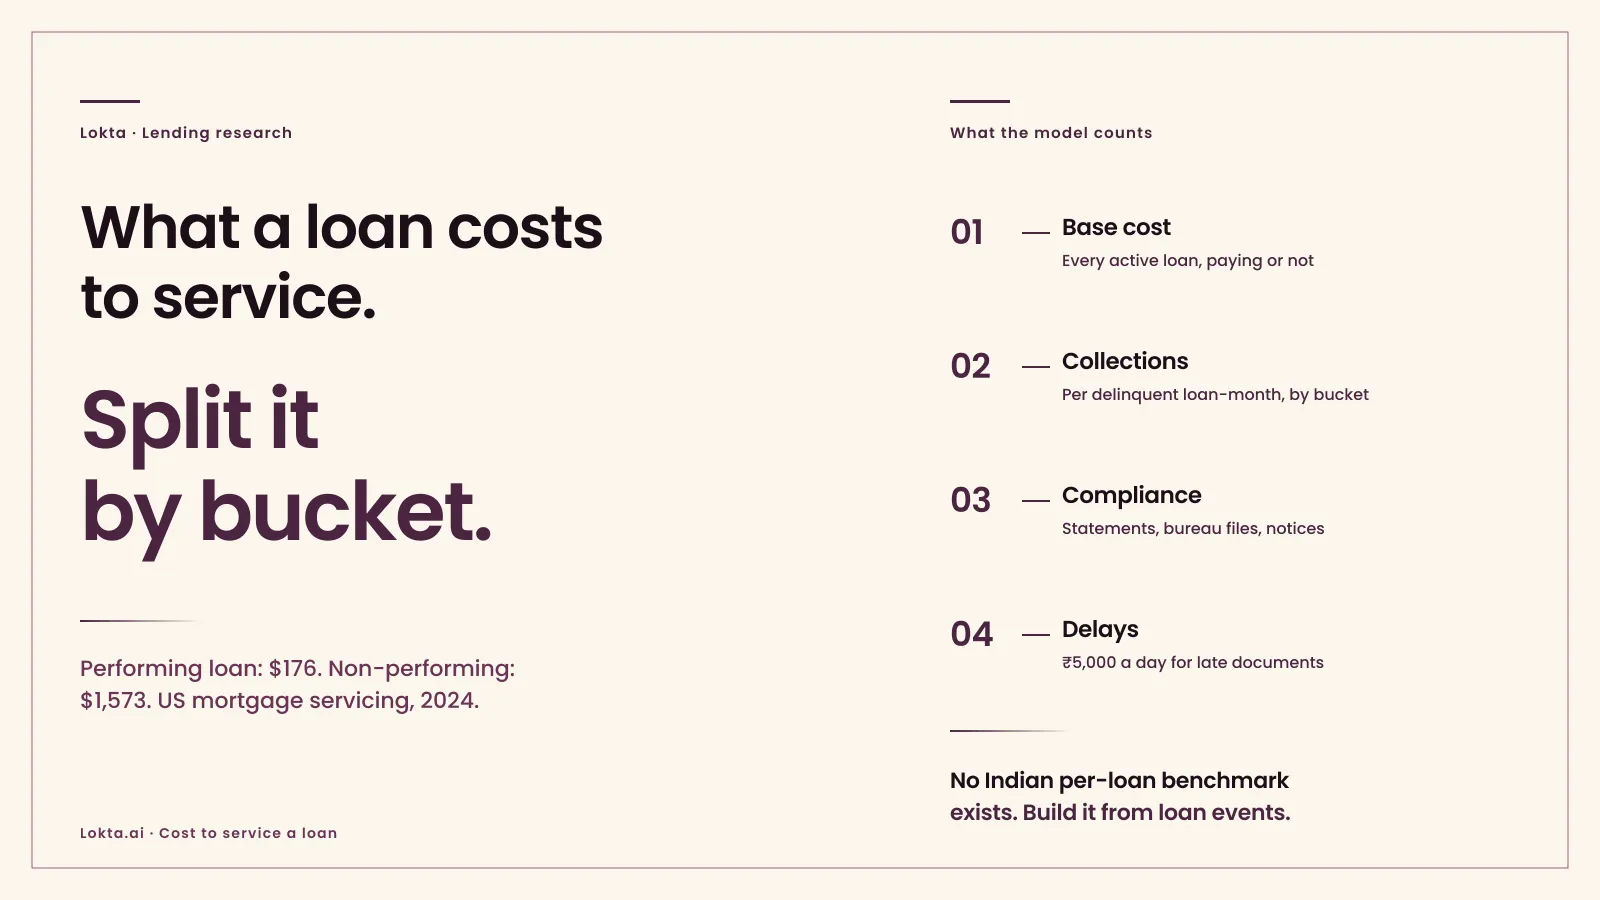
- Delinquency multiplies cost. In published US mortgage data, a non-performing loan cost close to nine times a performing one in 2024.
- Rules turn delays into per-day costs. On personal loans, property documents released late through the NBFC’s fault cost ₹5,000 a day. Bureau complaints unresolved after 30 days cost ₹100 a day, shared with the bureau.
- Build it from loan events. Allocate each cost line to the activity that drives it, logged on the loan.
Is there a benchmark cost per loan for Indian NBFCs?
No. RBI’s Report on Trend and Progress of Banking in India 2024-25, published on 29 December 2025, reports NBFC costs as ratios:
| Measure | 2023-24 | 2024-25 | H1 2025-26 |
|---|---|---|---|
| Cost-to-income, Upper and Middle Layer combined | 48.8% | 55.2% | 53.2% |
| Operating expenditure to total assets, Upper Layer | 2.8% | 2.6% | 2.6% |
| Operating expenditure to total assets, Middle Layer | 1.6% | 1.6% | 1.8% |
RBI marks its half-year ratios as annualised. All three rows cover Upper and Middle Layer NBFCs only, excluding core investment companies, housing finance companies and standalone primary dealers. In 2024-25, Upper Layer NBFCs spent ₹46,287 crore on operations against total assets of ₹17,81,991 crore, and Middle Layer NBFCs ₹70,617 crore against ₹43,27,135 crore.
Neither ratio is a servicing cost. RBI computes cost-to-income from total expenditure less interest expenses, so provisions and write-offs are inside it, and its report links the 2024-25 rise partly to higher provisioning and write-offs. Operating expenditure covers origination, head office and everything else as well as servicing. Both are useful for comparing lenders. Neither tells you what one loan costs to look after.
What does published per-loan data show?
The clearest public series comes from US mortgage servicing, which is a different product in a different market, so read it for its shape rather than its dollars. The Mortgage Bankers Association’s servicing operations study, drawn from in-house servicers holding about 60% of the US single-family servicing market, reported for 2024:
- a fully loaded cost of $176 to service a performing loan
- $1,573 to service a non-performing loan, close to nine times as much (this figure includes foreclosure costs and some unreimbursed losses)
- $127 to $132 per performing loan at the large bank and independent servicers, and about $100 more at mid-size ones
Two patterns are likely to hold in an Indian book too, though the figures will differ. Servicing cost concentrates in delinquent loans. And scale lowers the cost of a performing loan, because the fixed work of statements, systems and compliance spreads across more accounts.
What goes into the cost of servicing a loan?
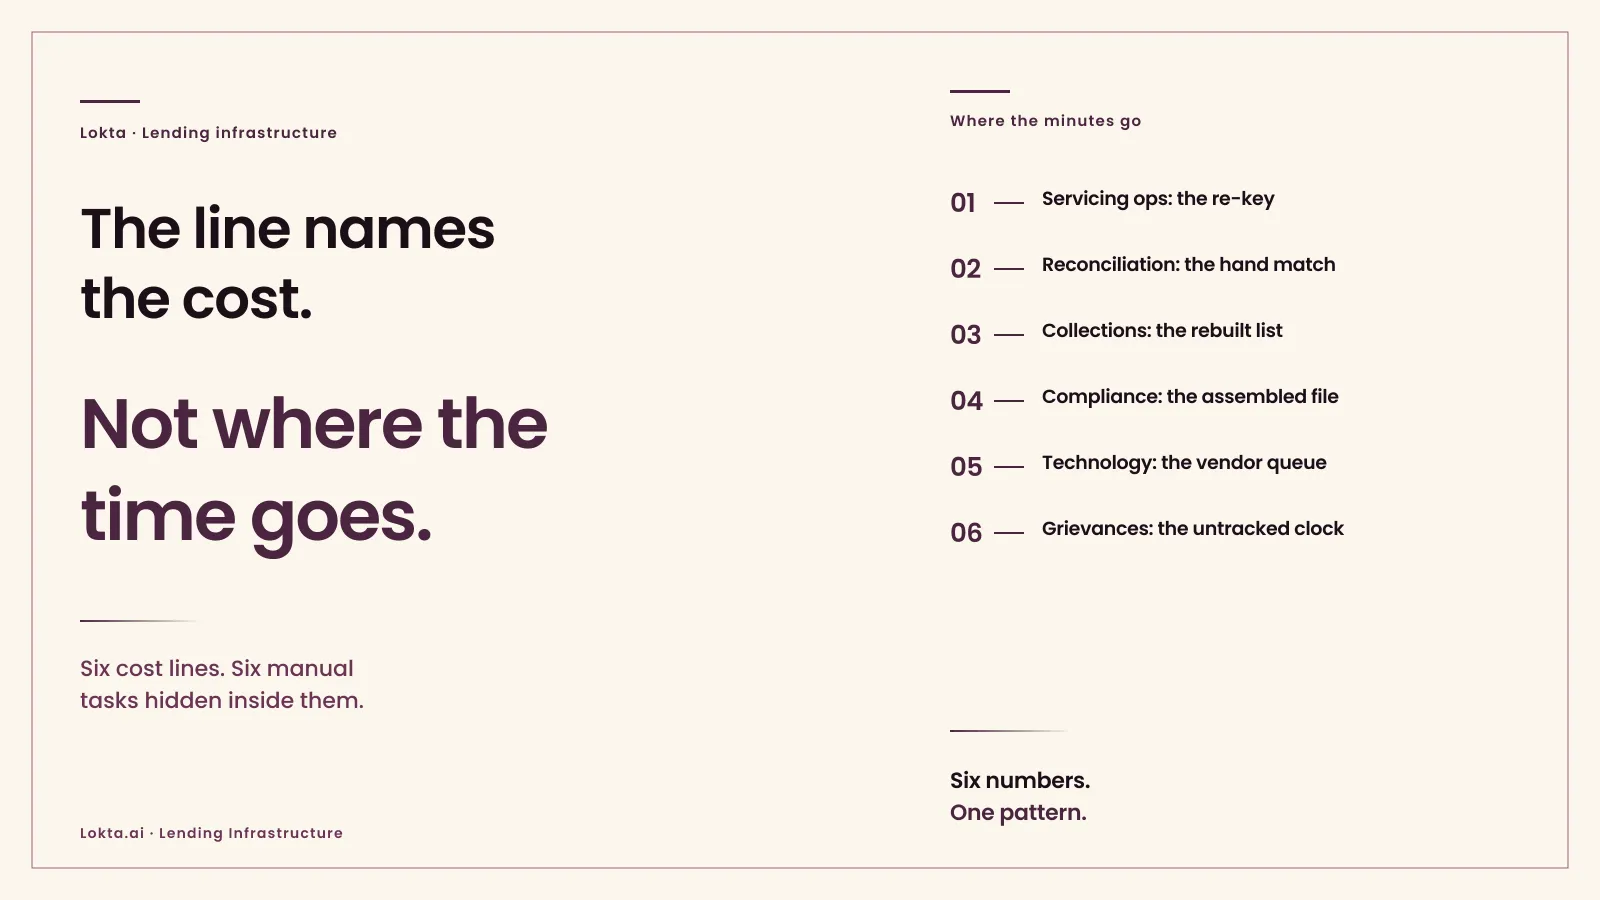
Six lines, each with its own driver:
| Cost line | What drives it | Allocate by |
|---|---|---|
| Servicing operations staff | Borrower queries, requests, changes and closures | Cases per loan |
| Payments and reconciliation | Receipts, mandate returns and unapplied money | Transactions per loan |
| Collections staff, field and agencies | Calls, messages, visits and agency fees | Delinquent loan-months, by bucket |
| Compliance and reporting | Bureau files, statements, notices and returns | Active loans |
| Technology | Loan system, messaging, payment and bureau integrations, hosting | Active loans, or per transaction where priced that way |
| Grievances and compensation | Complaints and per-day compensation for delays | Complaints |
Keep credit losses and funding cost out of it. They matter to profit, and they belong in their own lines. The loan system’s licence sits in the technology line, and the LMS cost post shows how to compare it across quotes.
Each of these six lines has a number. Where the time inside each one actually goes is a different question, and it is usually one specific manual task, not the line item as a whole.
Which RBI rules add recurring servicing work?
Seven recur on the live book, and two carry a daily price when they slip. From the Responsible Business Conduct Directions, 2025 and the Credit Information Reporting Directions, 2025:
- a statement each quarter for floating rate EMI-based personal loans, and immediate notice when a benchmark change raises the EMI or the tenor (conduct paragraph 31)
- the applicable penal charges named in each reminder, and the reason given whenever one is levied (conduct paragraph 30(7))
- for personal loans, original property documents released within 30 days of full repayment or settlement, with ₹5,000 compensation for each day of delay attributable to the NBFC (conduct paragraphs 35 and 39)
- trained recovery agents, an undertaking from each, and calls only within permitted hours (conduct paragraphs 98 to 100)
- bureau data submitted for four reference dates a month (credit information paragraph 10(2))
- an SMS or email to the borrower when default or days past due is reported to a bureau (credit information paragraph 34(1))
- ₹100 a day to a complainant whose credit information complaint is not resolved within 30 days, with the lender liable where it has not sent the correction within 21 days (credit information paragraph 35(1) and (2))
Microfinance loans add their own duties, such as a loan card for each borrower and police verification of recovery agents’ staff (conduct paragraphs 78 and 94). Each of these is work per active loan, per closure or per complaint, and it belongs in the model at that grain. The bureau reporting post and the recovery-agent rules post set out two of them in full.
How do you build a cost-per-loan model?
In three steps, from your own books and your loan system’s event history.
- Base cost per active loan per month. Take the month’s servicing cost from the six lines above, less the collections line and the share of other lines that delinquent accounts drive, and divide by the average number of active loans. This is what every loan costs, paying or not.
- Delinquency cost per loan-month, by bucket. Take the collections line, and the share of the other lines that delinquent accounts drive, and divide by the number of loan-months spent in each bucket: 1-30, 31-60, 61-90 and beyond. Contact and visit logs on each account let you allocate by effort rather than by headcount.
- Cost over a loan’s life. Multiply the base cost by the expected months on book. Add, for each bucket, the chance that a loan reaches it, times the months it typically spends there, times that bucket’s cost per loan-month. Add closure work, such as document release for a secured loan.
Every input in step 3 comes from history the loan system should already keep: months on book, roll and cure rates between buckets, and time spent in each. If those have to be rebuilt from spreadsheets, any error in the rebuild carries straight into the cost figures.
How does cost to service feed profit per loan disbursed?
Directly. For a loan, profit is the interest and fees it earns, less the cost of the money lent, less the credit loss, less what it cost to source and approve, less the cost of servicing it from disbursal to closure. Across a cohort, divide by the number of loans disbursed. For pricing decisions, the RAROC example also tests servicing expense against allocated economic capital and the lender’s return hurdle.
Servicing cost is also a line a collections or operations team can change directly. A collections strategy that cures more accounts in 1-30 can lower two lines at once: the credit loss, and the loan-months spent in expensive buckets. That is why the cost model has to split by bucket. A single average cannot show a collections change paying for itself.
How should an NBFC work out its cost per loan?
If you want to be the CFO who can tell the board what each product costs to service and why, the three routes below differ in one thing: how close to the loan the cost gets.
- Divide operating cost from the accounts by the average number of active loans. It needs no new data and ties to the audited numbers. It gives one average for the whole book, origination and head office included, so it cannot separate one product, channel or bucket from another.
- Allocate each cost line to the loan events that drive it, from the loan system’s record of payments, contacts, cases and bucket history, and refresh it every month. It takes a one-time mapping of cost lines to drivers and a loan system that keeps event history. After that, the cost of any product, channel or collections strategy is a query.
- Commission a one-off costing study. It gives a careful answer for one period. It goes stale as the book and the team change, and it cannot test next quarter’s collections strategy.
The second path needs an honest allocation of shared costs, which takes judgement and a finance team willing to revisit it as the book changes.
Lokta’s loan management system keeps a double-entry, event-sourced ledger with full replay of any book from its history, and on each account Lokta’s AI Loan Servicing tracks borrower contact and promises to pay. That covers the payment and contact history the model allocates against. Before Lokta, the same team built Apache Fineract.
Frequently asked questions
How much does it cost to service a loan in India?
There is no published per-loan figure for Indian NBFCs. RBI publishes ratios instead: operating expenditure was 2.6% of total assets for Upper Layer NBFCs and 1.6% for Middle Layer NBFCs in 2024-25, excluding core investment companies, housing finance companies and standalone primary dealers. Those ratios cover all operating cost, not servicing alone. An NBFC works out its own cost per loan by allocating servicing, collections, compliance and technology cost to the active loans and loan events that drive it.
Why does a delinquent loan cost more to service?
A delinquent loan draws work a performing loan does not: calls and messages, field visits, agency fees, notices, disputes and legal steps, on top of the base cost every loan carries. In US mortgage servicing, where the Mortgage Bankers Association publishes per-loan figures, a non-performing loan cost $1,573 to service in 2024 against $176 for a performing one, close to nine times as much. The ratio in an Indian consumer or MSME book will differ. The extra work a delinquent loan draws is the same in kind.
What is the cost-to-income ratio of NBFCs?
RBI's Report on Trend and Progress of Banking in India 2024-25 puts it at 55.2% in 2024-25 for Upper and Middle Layer NBFCs combined, up from 48.8% in 2023-24, and 53.2% for the first half of 2025-26. Those figures exclude core investment companies, housing finance companies and standalone primary dealers. RBI calculates it as total expenditure less interest expenses, divided by total income less interest expenses, so provisions and write-offs sit inside it. It measures the whole business, not the cost of servicing a loan.
How do you calculate cost per loan?
Split the month's servicing cost into what every loan draws and what delinquent loans draw. Allocate each cost line to the activity that drives it: payments and reconciliation by transactions, collections by delinquent loan-months in each bucket, queries by cases. The result is a base cost per active loan per month and a separate cost per delinquent loan-month by bucket. Multiply through a loan's expected life to get the cost to service it from disbursal to closure.
Sources:
- RBI, Report on Trend and Progress of Banking in India 2024-25, 29 December 2025: Chapter VI, Table VI.9 and paragraph VI.28, and Appendix Tables VI.6 and VI.7.
- Mortgage Bankers Association, Chart of the Week: Cost of Servicing Performing and Non-Performing Loans, 28 July 2025.
- RBI, Reserve Bank of India (Non-Banking Financial Companies - Responsible Business Conduct) Directions, 2025: paragraphs 3(11), 30(7), 31, 35, 39, 78, 94 and 98 to 100.
- RBI, Reserve Bank of India (Non-Banking Financial Companies - Credit Information Reporting) Directions, 2025: paragraphs 10(2), 34(1), 35(1) and 35(2).