Got your lending licence? Choose a loan management stack built for profitable operations
Choose a new lender’s loan management stack through ROA, ROE, credit losses and opex. Map collections, partners, reporting and compliance to operating tests.
A newly licensed lender needs a post-approval stack that keeps the loan account and ledger reliable, coordinates collections, manages partner obligations, produces traceable reporting and retains compliance evidence. A Loan Management System (LMS) maintains the account; loan servicing is the work of operating it across its life. Choose both against the economics of the book.
Credit losses and operating expense can consume the margin that looked attractive when the loan was priced. Borrowed funding makes that operating result more consequential for equity. The buying question is which work the stack can improve, what it costs to run and what evidence would justify the investment.
See the stack in one view
| Layer | What it must make reliable |
|---|---|
| LMS and loan ledger | Schedules, dues, transactions, reconciliation and the history behind each balance |
| Collections and borrower service | Current-account treatment, permitted contact, promises to pay and reviewed exceptions |
| Partner management | Loan attribution, arrangement versions, fee calculation and invoice approval |
| Reporting, including AI assistance | Defined metrics, dated sources, reconciled totals and review of generated explanations |
| Compliance and model governance | Applicable policies, approvals, evidence, monitoring and accountable owners |
| Wider architecture to arrange separately | Origination and underwriting, identity services, bank and payment rails, enterprise finance, treasury and security operations |
Lokta’s available-now scope is Loan Management, AI Loan Servicing and RBI Model Risk Management. Loan Origination is roadmap. The wider architecture still needs named owners and verified interfaces; a product list does not establish a particular external connection.
Put the profit bridge before the feature list
Use one consistent period and accounting perimeter. In a simplified model, income less funding expense, credit-loss expense, operating expense and tax gives profit after tax. Define return on assets (ROA) as that profit divided by average assets, and return on equity (ROE) as the same profit divided by average equity.
With those definitions:
ROE = ROA × average assets ÷ average equity.
This identity explains why the operating result matters to shareholders. It does not imply that adding debt mechanically improves returns: funding expense, risk and capital constraints can change with the financing decision. Leverage magnifies the effect of losses as well as positive returns.
Credit cost and opex are major levers. They are not 100% of the explanation. Yield, funding cost, asset mix, fee income, tax and the capital structure also matter. RBI’s September 2024 NBFC analysis attributes the historical profitability advantage of upper-layer over middle-layer NBFCs to lower provisions and interest expense. It does not establish an opex effect. Separately, a FY25 study of 31 NBFCs reports cost-to-income moving from 36.7% in FY24 to 36.2% in FY25. That is a defined sample, not a sector census or proof of software impact.
Price the stack inside the profit bridge
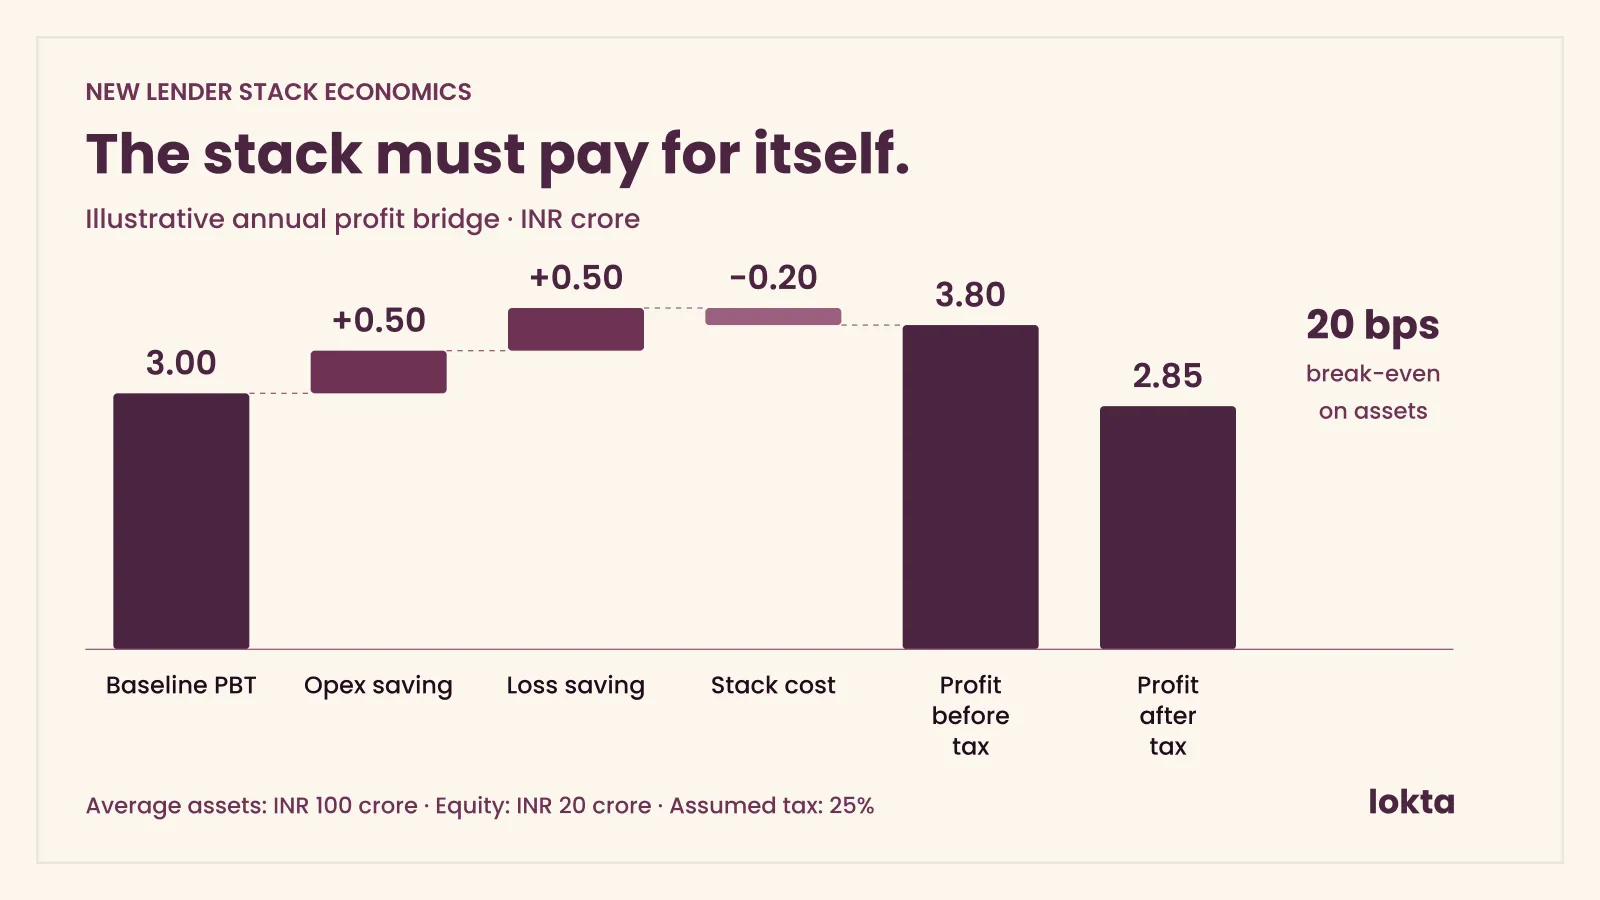
Use a synthetic annual model with average assets of ₹100 crore and equity of ₹20 crore. Assume the other ₹80 crore is borrowing at 10%, giving ₹8 crore of funding expense. Income is ₹16 crore. Apply an illustrative 25% tax to positive profit, with no tax benefit on losses. These are transparent planning assumptions, not a sector benchmark, tax forecast or Lokta outcome.
In the proposed-stack column, test ₹0.50 crore each of gross opex and credit-loss savings against ₹0.20 crore of incremental annual stack expense. This cost includes the technology, integration, support and implementation expense recognised in the period. The baseline opex already includes existing technology; avoid counting it twice. The saving assumptions are targets to validate, not benefits attributed to a purchase.
| ₹ crore, except returns | Baseline | Proposed-stack sensitivity | Credit-loss downside |
|---|---|---|---|
| Income | 16.00 | 16.00 | 16.00 |
| Funding expense | 8.00 | 8.00 | 8.00 |
| Credit-loss expense | 2.00 | 1.50 | 4.00 |
| Opex before incremental stack | 3.00 | 2.50 | 3.00 |
| Incremental stack expense | 0.00 | 0.20 | 0.00 |
| Profit before tax | 3.00 | 3.80 | 1.00 |
| Tax at assumed 25% | 0.75 | 0.95 | 0.25 |
| Profit after tax | 2.25 | 2.85 | 0.75 |
| ROA | 2.25% | 2.85% | 0.75% |
| ROE | 11.25% | 14.25% | 3.75% |
The ₹1 crore gross saving becomes ₹0.80 crore after the stack’s own expense, then ₹0.60 crore after tax. ROE rises by three percentage points in this sensitivity. In the independent downside, doubling credit-loss expense reduces ROE to 3.75%.
The break-even requirement is more useful than the optimistic column: ₹0.20 crore ÷ ₹100 crore × 10,000 = 20 basis points of average assets. The stack must support at least ₹20 lakh of combined annual opex and credit-loss improvement to cover its incremental expense before tax, with the other inputs held fixed. If only ₹10 lakh is evidenced, the proposal has a ₹10 lakh shortfall. Count costs and savings over the same period.
Credit-loss expense is an accounting expense, not a delinquency percentage or a cash-collection shortfall. For a cohort calculation using economic capital, use the RAROC pricing example.
Show what leverage changes
Keep the same ₹100 crore of assets, ₹16 crore income and ₹3 crore opex. Compare two financing structures at the assumed 10% borrowing cost. This changes funding expense as well as the equity denominator.
| Average equity / borrowings | ROE with ₹2 crore credit loss | ROE with ₹4 crore credit loss |
|---|---|---|
| ₹20 crore / ₹80 crore | 11.25% (PAT ₹2.25 crore) | 3.75% (PAT ₹0.75 crore) |
| ₹10 crore / ₹90 crore | 15.00% (PAT ₹1.50 crore) | 0.00% (PAT ₹0) |
With less equity, baseline ROE rises to 15% even though higher funding costs reduce absolute profit to ₹1.50 crore. Funding expense is now ₹9 crore. But the same ₹2 crore deterioration in credit-loss expense removes the entire profit at the higher leverage. This is a sensitivity, not a capital-structure recommendation; regulatory capital requirements and the lender’s risk appetite constrain the actual choice.
Trace the expense to work someone can change
A credit-loss line does not tell an operations head what to do tomorrow. Break it into processes that can be observed: monitoring a weakening account, reaching the right borrower, applying an authorised treatment and following its outcome. Underwriting, portfolio composition and external conditions remain major drivers outside this servicing scope.
Do the same for opex. The cost-to-service model connects time spent resolving unmatched receipts, reconstructing complaints, checking partner fees and rebuilding reports to the book. Record reopens and errors as well as handling time. Removing a reviewer can lower one cost line while increasing mistakes elsewhere.
The post-approval profit model explains why these decisions continue after a loan is booked. A more expensive stack may have a better total operating case if it reduces evidenced work or risk enough to cover its cost. A cheaper one may be adequate for a simpler book. Neither conclusion follows from a demonstration or a list of modules. Compare the lender’s required outcomes and the cost of producing them.
Turn the stack into five acceptance tests
The following worksheet connects these five capabilities to operating evidence. These are buyer requirements, not assertions that every listed interface or report is already configured in a specific deployment.
| Capability | Accountable operator | Acceptance test | Baseline to retain |
|---|---|---|---|
| Loan Management and reconciliation | Operations and finance | Match a receipt, post it once and explain schedule, balance and accounting outputs | Unmatched value and age, correction effort |
| Collections and borrower service | Collections and service leads | Clear targeted dues and prove the obsolete demand is withdrawn | Handling time, stale demands, treatment outcomes |
| Partner management | Partner operations and finance | Reproduce one invoice from attributed loans and the arrangement version in force | Disputed fees, reconciliation effort, partner cohort performance |
| AI-assisted reporting | Finance and portfolio owners | Trace a generated answer to dated source records, definitions and reconciled totals | Preparation effort, discrepancies, unsupported answers |
| Compliance and model governance | Compliance, risk and control owners | Reconstruct an action, applicable policy, approval and resulting record | Missing evidence, unresolved findings, preparation time |
Download the Excel profit-bridge and acceptance worksheet (.xlsx). Edit the blue inputs to calculate funding expense, profit, ROA, ROE and the stack’s break-even basis points. Its second sheet records source evidence, acceptance results, costs and change lead time. A report generated in seconds still fails if its denominator or cutoff cannot be explained. AI should help investigate and present the record while authoritative calculations and approved definitions remain controlled.
Include the price of changing your mind
Before signing, choose one likely policy change and ask who implements it, what it costs and when it can reach production. Include vendor charges, internal analysis, regression testing, approvals and continuing maintenance. A small development estimate can sit behind a long delivery queue.
The burden has two effects: expense and time to market. Value a delay using justified incremental contribution and the distinction between deferred and lost business. Do not label gross lending volume as lost profit. The LMS cost and scope comparison provides a worked change-request example.
Evaluate Lokta’s Loan Management and AI Loan Servicing against the account and collections tests above. Sourcing partner management connects partner records, arrangement versions, attributed loans and fee workflows. For reporting, require the generated explanation to identify its source period and reconcile to the same totals finance uses.
The aim is stronger profit per loan disbursed. The lender retains accountability for policy and compliance; the investment case depends on evidenced benefit after the full cost of running the stack.
Set the hurdle for a stack evaluation in rupees and basis points before comparing modules. For the example here, that means finding and verifying ₹20 lakh of annual benefit. Then rehearse the first repayment cycle with the people who must produce it.
Frequently asked questions
What technology does a newly licensed lender need to operate its loan book?
An LMS and loan ledger, reconciliation, collections and borrower service, partner management, traceable reporting, and compliance and model-governance controls. Assign separate owners for origination, underwriting, identity services, bank rails, treasury, security and enterprise finance. Verify the interfaces as well as the individual modules.
How can loan management software affect ROA and ROE?
It can support operating processes that influence handling expense, errors, collections and visibility into the book. Any financial effect must be measured after implementation and continuing costs, with other changes accounted for. Under consistent definitions, ROA is profit after tax divided by average assets, and ROE is the same profit divided by average equity. The software does not independently determine either return: income, funding, credit performance, asset mix, tax and capital structure also matter.
Do credit cost and opex determine all of a lender’s profitability?
They are major operating levers, but they are not the only determinants. Loan income, funding expense, asset utilisation, fee income, tax and the capital structure also affect returns. Credit losses depend on underwriting, portfolio mix and external conditions as well as post-approval work. Cutting every operating cost can weaken controls or collections. Evaluate the combined economics and risk, including the cost of the technology and people required to run the process.
How much benefit must a new loan management stack produce to break even?
In the illustration, ₹20 lakh of incremental annual stack expense over ₹100 crore of average assets requires 20 basis points of combined opex and credit-loss improvement before tax. Count recognised implementation and recurring costs, avoid double counting savings, and replace the assumptions with measured evidence.
Read next
- Loan pricing and RAROC: take the economic analysis down to a loan cohort
- LMS total cost and change requests: compare supplier scope, internal effort and time to market
- First repayment cycle rehearsal: test the operating team before the book reaches its first cycle
- Choose an automation pilot: sequence investment using eligible work and observed evidence
Sources
- RBI Bulletin: Peeling the Layers, September 20, 2024: historical analysis linking profitability differences to provisions and interest expense. It is not a current sector benchmark or evidence of software impact
- Lokta Loan Management: current post-approval product scope
- Lokta sourcing partner management: partner records, effective-dated arrangements, loan attribution and fee workflows
Lokta editorial analysis by Chandramouli, co-founder and CEO.